Australia has a major emissions reduction challenge if the 2030 target is to be achieved. Energetics' revised modelling of the emissions reduction trajectory shows that the cumulative abatement task of just over 1 billion tonnes CO2-e is equivalent to almost two years of business as usual emissions. In addition, emissions across the economy are currently rising, making the challenge of meeting the 2030 target substantially more difficult. The Safeguard Mechanism has the potential to significantly reduce emissions provided the government reduces baselines at an appropriate rate.
The major challenge will always be electricity, and the current sector wide baseline of 198 million tonnes of CO2-e will need to be significantly reduced and in a way, that encourages the closure of some of Australia’s older high emissions intensity coal-fired power stations.
This article outlines Energetics’ modelling which supports the case for early action to address rising emissions.
Our 2020 cumulative abatement target will be met, but emissions are currently on the rise
The Commonwealth released its latest projection of Australia’s greenhouse gas emissions late in 20161. This projection confirmed earlier work by Energetics that showed how Australia will meet its 2020 cumulative emissions reduction target and will do so without requiring the use of offsets carried over from the 2012 target (see Box 1).
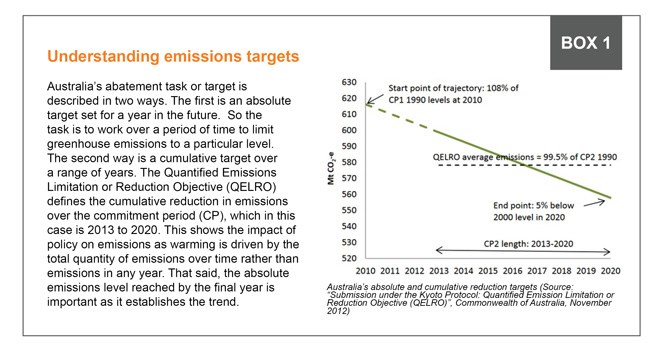
However, the Commonwealth’s projection also confirmed that Australia’s emissions are now rising, and that meeting the 2020 target will be due to the good work done over the period from 2013 to 2016 rather than the result of activities from 2016 through to 2020. As a result, by 2020 emissions will be more than 5% higher than those in 2000 despite meeting our cumulative target.
It is therefore clear that as we look to the 2017 Climate Policy Review our focus needs to be on reversing the current upward trend in emissions and the actions required to meet the 2030 reduction target. In this paper we both review the emissions trajectory and demonstrate that action taken now to reduce emissions is far more effective – and economically responsible - than action taken closer to the 2030 deadline.
Taking another look at the 2030 abatement challenge
In the Commonwealth’s latest emissions revision we saw the inclusion of a number of factors that are expected to drive down emissions compared to earlier projections. These include:
• Abatement over the period 2021 to 2030 from existing and anticipated contracts under the $2.55 billion ERF
• The large-scale Renewable Energy Target (RET) of 33,000 GWh
• The anticipated closure of Hazelwood power station in Victoria in April 2017
• Flatter electricity demand driven by:
• Improvements to energy efficiency
• Additional behind the meter solar PV
• Lower production levels in the non-ferrous metal manufacturing, coal and LNG industries.
Energetics’ estimates that inclusion of the ERF contracts alone reduces the projected emissions to 2020 by 50 Mt CO2-e and projected emissions to 2030 by 120 Mt CO2-e.
Overall, the Commonwealth estimated that emissions under ‘business as usual’ will be 592 Mt CO2-e in 2030 and that cumulative emissions will exceed the 2030 target by 1055 Mt CO2-e2.
Energetics’ own modelling suggests that Australia we will exceed its cumulative target by 1042 Mt CO2-e under the current suite of policy measures (see Box 2).
What happens to emissions reductions through to 2030 in the context of GDP growth?
Stronger policy intervention is required to direct Australia towards our 2030 targets.
The following figure shows Australia’s 2030 abatement challenge from a new perspective. The figure plots national emissions excluding emissions from land-use, land-use change and forestry (LULUCF) against gross domestic product (GDP) in the period from 1990 to 2016.
The graph also shows one possible trajectory of emissions to 2030 that meets the 2030 reduction target. The forecast of GDP is based on figures from the Australian Treasury and from the OECD. Because Australia’s GDP has always grown and is projected to grow from year to year to 2030, the graph is also effectively an emissions time series.
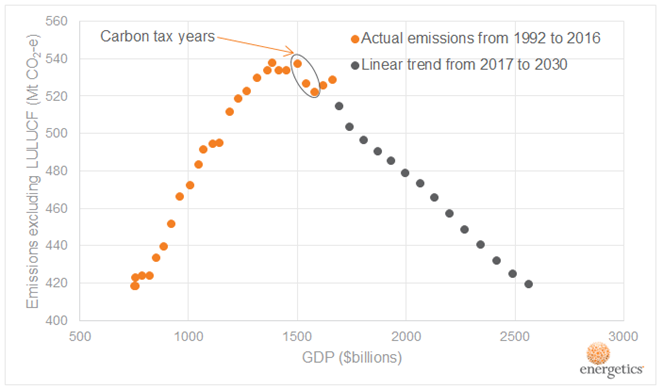
Figure 1: Australia's emissions excluding LULUCF and GDP to 2030: actual to 2016 and potential through to 2030 if policies can deliver the same rate of reduction achieved between 2012-14.
The figure above demonstrates the emissions reduction task against the backdrop of a growing economy. Two interesting features stand out:
• From the period from 1992 to around 2012, Australia’s emissions usually rose from year to year. The major departures from this trend – times when emissions were basically constant corresponded to periods of global economic slowdown - the recession at the beginning of the 90s, the ‘tech wreck’ period around the turn-of-the-century and the Global Financial Crisis
• The years from 2012 to 2014 essentially spanned the period of the carbon tax and the figure shows a rapid fall in emissions over that time. Since the repeal of the carbon tax, emissions have risen at basically the same rate as they did from 1990 to 2008.
So what insights do we gain for the 2017 Climate Policy Review? What we see is that the emissions reductions achieved during the period of the carbon tax essentially align with the rate of reduction required to meet the 2030 target. For policy makers this offers an indication of the level of policy intervention that may be required to achieve the national target in the years through to 2030.
For every tonne of abatement achieved prior to 2020, Australia’s emissions reduction task to achieve our 2030 target is reduced by a factor of three
If key policies and programs are brought forward, Energetics found that they must deliver around 106 Mt CO2-e of cumulative abatement over the period from 2016 to 2020 to meet the 5 per cent reduction target in 2020.
This has the effect of reducing the cumulative abatement task from 2020 to 2030 by 374 Mt CO2-e.
The cumulative abatement target in the period for 2020 to 2030 is therefore reduced to 817 Mt CO2-e.
Energetics forecast of emissions to 2020 only considered the impact of the Emissions Reduction Fund. However, there are several other national policies and programs that will be in force during the period to 2030. In our report released in May 2016, Modelling and analysis of Australia’s abatement opportunities: Meeting Australia’s 2030 emissions reduction target, our work showed that the current suite of national policies and programs have the potential to deliver the abatement needed to meet the 2030 target.
These include the programs under the National Energy Productivity Plan, the phase-out of alternatives to ozone depleting gases that have high global warming potential, and the Safeguard Mechanism.
The key now is to bring some of those policies forward; particularly the introduction of the National Energy Productivity Plan and the wider deployment of new energy saving measures in the built environment, so that the emissions in 2020 do not exceed the 5 per cent reduction target.
Back in 2006 the Stern report drew the attention of governments, investors and climate campaigners across the world with its calls for early action to reduce the significant future economic and societal costs that come with delays. Energetics’ modelling further reinforces this argument for action now to reverse the current upward trend in national emissions.
Referencing
[1] Commonwealth of Australia | Australia’s emissions projections 2016
[2] The Commonwealth actually reported a range of 990 to 1055 Mt CO2-e in the abatement task to reflect the range in the 2030 emissions reduction target of 26% to 28% relative to 2005