Energetics’ first flexible working contract was awarded in 2007. Since that time we have transitioned to being a company that has approximately 50% of our work force on some form of formal flexible working conditions, ranging from reduced hours to set working from home days. We are very good at enabling our people to work flexibly while still protecting the boundaries between work and home.
Only recently however has the linkage between our ability to enable our people to work flexibly and our core business of assisting Australia’s largest energy users to transition to a low carbon future become apparent. Given the amount of work that the built environment and infrastructure will have to do to meet our mid-century targets under the Paris Agreement, the changing nature of work should not be overlooked.


What is the magnitude of the emissions reduction challenge?
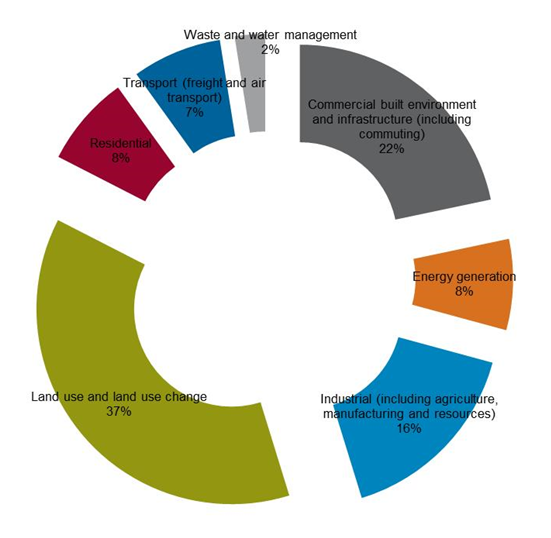
In 2016 Energetics undertook a significant piece of work on modelling emissions reductions to 2030 for the (then) Federal Department of Environment[1]. You can read more in the National Energy and Climate Policy Centre on our website. Our work indicates that a cumulative total reduction of 963 Mt CO2-e by 2030 is possible. For the purposes of this article, the opportunities from the report have been aggregated into different sectors to build Figure 1. The sectors considered in this figure have been chosen to specifically draw out the emissions reduction potential of changing where and how we work. For this reason the following sectors are defined:
- Commercial built environment and infrastructure/the built form, including commuting
- Transport, freight transport and air transport
- Residential
- Industrial which has a broad definition including agriculture, manufacturing and resources
- Energy generation
- Land use and land use change
- Waste and water management


Figure 1: Cumulative contribution of sectors to emissions reduction by 2030
This figure demonstrates that, after land use and land use change, the sector which has the greatest potential to contribute to Australia’s emissions reduction challenge by 2030 is the built environment.
Underlying constructs
This information is based on analysis of emissions reductions requirements and potentials to 2030. Of interest here are the opportunities listed below which relate to the changing nature of work, and the changing infrastructure requirements which will underpin this change.
Table 1: Abatement potential
|
Group |
Opportunity |
Cumulative abatement potential by 2030 - (Mt CO2-e) |
Contribution to total (%) |
|
Low carbon precincts |
Integrated urban transport |
10.2 |
1.1 |
|
Precinct scale design |
16.3 |
1.7 |
|
|
Digital infrastructure |
Smart hubs/teleworking |
2.3 |
0.2 |
In the work conducted to date the impact of the changing nature of work to 2030 is projected to be limited. At the same time using commercial buildings differently by changing how we choose to work could contribute some of the total impact of new builds on emissions reductions which is 14 Mt CO2-e (or 1.5% of total emissions reductions). This would suggest that the impact of changing working conditions could contribute between 3% and 5% of total emissions reductions required to 2030 to ensure we are on a trajectory to meet our 2oC target in 2050.
How flexibility can help
In order to assess whether this is a fair reflection of how changing how and where we work has the potential to contribute to emissions reductions we need to look at what flexibility has the potential to change.
What does working differently look like?
It is easy to refer to 'the changing nature of work', it is in trying to define what this means that the challenge lies. The aspects which are most likely to impact emissions are:
- Going to work to meet, not to work: how many times do you hear people say “I’ll work from home today; it’s the only way I get stuff done.”? Increasingly we will see people going into the office for fewer days and fewer hours in the day.
- Reduced transport requirements for commuting
- Increased intensity of use for residential buildings: where people do work from home, to a great extent this needs to be underpinned by adequate access to data.
- Potential for regional hubs of co-working spaces will grow where people find it difficult to work from home, or preferable to leave the house.
Impacts on the built form
Currently large commercial buildings are constructed to service a 40 hour work week. They typically are at peak energy (and emissions) loads for 60 hours a week; with significant effort invested in reducing energy and emissions from the building for the remaining 108 hours of the week. We chose to construct large buildings which are designed to be essentially vacant for more than 50% of their life. There are standards that require that the emissions intensity of the built form is understood and reduced (such as GreenStar), but the fact remains that the majority of building stock is still constructed using steel and concrete, both of which are emissions intensive.
As we look to 2050 we need to consider intensifying how buildings are used, potentially reducing desk space and focussing on meeting areas – but also considering how we might make a building ‘work’ 168 hours a week, and not only 60. That way we will get better return for the emissions we invest on constructing the buildings in the first place.
Impacts on transport infrastructure
Changing how and where we work could reduce the total emissions impacts of transport by simply reducing the number of trips taken. Although it is unlikely to be so straightforward, as public transport would continue to operate irrespective of the number of commuters (within reason). Two effects could result:
- A reduction in commuters and a reduced load on public transport. The potential does exist for people to switch more readily from cars to public transport.
- The impact of electric vehicles may be reduced as people make fewer trips.
The overall impact is likely to be reduced use of roads and lower vehicle emissions.
Impacts on residential emissions
As people choose to work more frequently from home, the efficiency of our current residential building stock will come into question. The potential exists for emissions to increase as people use less efficient heating and cooling technology at home than they do at the office. The ability to address these impacts is much reduced compared to a corporation’s ability to address their impacts on climate change, and may need to form a part of work from home conditions. An example here is that companies may require you to undertake a home energy audit or emissions assessment as part of a work from home agreement.
Impacts closer to home
The potential also exists for changing work arrangements to enhance the growth of regional hubs and co-working spaces, and reduce the number of people who head into the office. We have seen some evidence of this where restaurants have opened their doors as co-working spaces during the daytime when they are usually closed. These buildings are now utilised for more than 80% of the working week, as opposed to many commercial buildings which are utilised for well less than 40% of a week.
Understanding the potential opportunity
How people choose to work in the future has potential to help Australia in meeting our mid-century targets. Moving the focus of commercial buildings to being on places to meet as opposed to places to work, and seeking innovative opportunities to increase their utilisation beyond the current rate of approximately 35% will contribute significantly to emissions reductions both from emissions associated with materials of construction, and from the use of the building itself. Changing transport patterns will also contribute to lower total emissions.
Care needs to be taken that inefficient residential building stock does not undermine these emissions reductions. Planning needs to adequately consider that people may want to work flexibly from somewhere near home, if they do not want to work from home itself.
Table 2: Abatement potential of different groups of opportunities to 2030[2]
|
Group |
Opportunity |
Cumulative abatement potential by 2030 - (Mt CO2-e) |
|
Built environment |
Commercial new builds and retrofits |
14.0 |
|
Residential new builds |
15.2 |
|
|
Solar PV |
36.7 |
|
|
Low carbon precincts |
Integrated urban transport |
10.2 |
|
Precinct scale design |
16.3 |
|
|
Digital infrastructure |
Smart hubs/teleworking |
2.3 |
|
Intelligent traveller information systems |
5.6 |
|
|
Intelligent management systems |
Advanced building management systems |
12.1 |
|
Advanced energy management systems - industrial and mining |
8.2 |
|
|
Fuel management systems |
5.3 |
|
|
Process and supply chain optimisation |
4.2 |
|
|
Autonomous mining |
2.0 |
|
|
Fleet management systems |
8.0 |
|
|
Reduced transmission and distribution losses |
13.1 |
|
|
High performance energy |
Operational and capital improvements to |
40.0 |
|
Biomass co-firing |
0.0 |
|
|
Battery storage |
10.2 |
|
|
Distributed generation |
9.2 |
|
|
Coal to gas shift |
0.0 |
|
|
Onshore wind |
0.0 |
|
|
Energy efficient equipment (industrial) |
Farm vehicle efficiency |
2.3 |
|
Irrigation |
3.2 |
|
|
Aluminium energy efficiency |
15.8 |
|
|
Cement clinker substitution by slag |
5.6 |
|
|
Manufacturing processes and fuel shift |
23.6 |
|
|
Operational improvements to mine fleets |
18.7 |
|
|
Plant optimisation |
1.9 |
|
|
Optimisation of haulage fuel |
12.6 |
|
|
Energy efficient equipment |
High efficiency residential appliances and |
20.6 |
|
Phase out inefficient data centres |
2.2 |
|
|
Commercial lighting and appliance |
44.5 |
|
|
Low carbon transport |
Mandatory fuel efficiency standards for light |
53.4 |
|
Improvements in aircraft performance |
23.5 |
|
|
Optimising existing transport systems |
6.4 |
|
|
Improvements heavy vehicle efficiency |
40.8 |
|
|
Biofuels in aviation |
7.1 |
|
|
Plug-in electric vehicles |
1.7 |
|
|
Land management |
Reduced cropland soil emissions |
2.8 |
|
Pasture and grassland management |
62.0 |
|
|
Cropland carbon sequestration |
6.9 |
|
|
Low emission livestock management |
14.6 |
|
|
Degraded farmland restoration |
26.0 |
|
|
Reforestation of marginal land |
102.3 |
|
|
Reduce deforestation |
59.0 |
|
|
Strategic forestation |
73.0 |
|
|
Improved forest management |
12.5 |
|
|
Fugitive emissions |
Degasification and oxidation of Ventilation |
30.3 |
|
Chronic leaks of natural gas |
1.5 |
|
|
Reducing flaring emissions |
10.9 |
|
|
Waste management |
Alternative waste treatment |
22.6 |
|
Solid waste |
1.6 |
|
|
Management of gases |
Management of synthetic gases |
40.1 |
|
Total |
962.6 |
References
[1] Environment.gov.au | Modelling and Analysis of Australia's Abatement Opportunities
[2] Based on Appendix A of above


